Justin Sullivan/Getty Images News
Investment Thesis
- In this comparative analysis, I will show you that I currently consider Tesla (NASDAQ:TSLA) to be the more attractive investment when compared to Ford (NYSE:F).
- At the companies’ current stock prices, my DCF Model shows an expected compound annual rate of return of 10% for Tesla and 4% for Ford.
- Tesla does not only have a higher profitability than Ford (Tesla’s EBIT Margin is 16.66% while Ford’s is 7.05% and Tesla’s Return on Equity is 32.24% while Ford’s is 22.49%), but also significantly higher Growth Rates (Tesla’s Revenue Growth Rate over the last five years [CAGR] is 47.41% while Ford’s is -0.31%).
- Although I rate both companies as a hold at this moment in time, I would select Tesla over Ford if I were to choose one of the two.
- I see significantly more growth drivers for Tesla than I see for Ford.
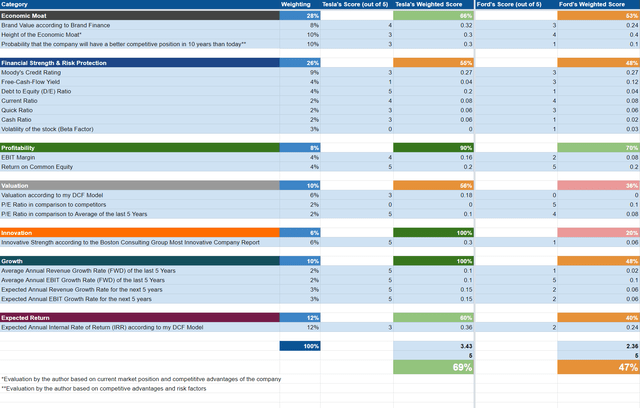
- My choice is underlined by the results of the HQC Scorecard, in which Tesla scores an attractive overall rating in terms of risk and reward (69/100 points) while Ford only achieves a moderately attractive overall rating (47/100 points).
The Competitive Advantages and Growth Drivers of Tesla and Ford
In my previous analysis on Tesla, I mentioned the company’s competitive advantages: its strong brand image, high customer loyalty, artificial intelligence, culture of innovation as well as its software and own supply chain. I see these competitive advantages as being strong growth drivers for the company in the years to come.
In the same analysis on Tesla, I particularly emphasized the company’s artificial intelligence and its culture of innovation as being one of its growth engines:
“Tesla CEO, Elon Musk, mentioned that in the long run, people will think about Tesla not as a car company or as an energy company, but as an Artificial Intelligence [AI] company. In the field of Artificial Intelligence, Tesla is working on a wide range of projects: one of these projects for example, is Tesla’s supercomputer Dojo, which trains AI systems to complete complex tasks like Tesla’s driver-assistance system ‘Autopilot’.”
When taking a closer look at Ford’s competitive advantages, it can be highlighted that the company’s brand image and its relatively high expenditures in research and development have contributed to the fact that it has been able to build an economic moat. In 2021, Ford’s spending in research and development was $7.6B. In addition to that, Ford announced in March that it plans to produce 2M electric vehicles annually by 2026 and that it aims to reach a 10% adjusted EBIT margin by 2026.
Although both companies dispose of competitive advantages over their opponents, I see Tesla’s as being significantly stronger growth drivers; in particular, its artificial intelligence, its culture of innovation and its own supply chain. Tesla’s stronger growth engines reinforce my opinion to select the company over Ford.
The Valuation of Tesla and Ford
Discounted Cash Flow [DCF]-Model
I have used the DCF Model to determine the intrinsic value of Tesla and Ford. The method calculates a fair value of $180.03 for Tesla and $7.52 for Ford.
At the current stock prices, this gives Tesla an upside of 2.03% and Ford a downside of 46.30%.
My calculations are based on the following assumptions as presented below (in $ millions except per share items):
|
Tesla |
Ford |
|
|
Company Ticker |
TSLA |
F |
|
Tax Rate |
11% |
22% |
|
Discount Rate [WACC] |
9.25% |
16.80% |
|
Perpetual Growth Rate |
4% |
3% |
|
EV/EBITDA Multiple |
34.7x |
9.1x |
|
Current Price/Share |
$178.00 |
$14.00 |
|
Shares Outstanding |
3,158 |
4,020 |
Source: The Author
Based on the above, I have calculated the following results:
Market Value vs. Intrinsic Value
|
Tesla |
Ford |
|
|
Market Value |
$178.00 |
$14.00 |
|
Upside |
2.03% |
-46.3% |
|
Intrinsic Value |
$180.03 |
$7.52 |
Source: The Author
Internal Rate of Return for Tesla
Below you can find the Internal Rate of Return as according to my DCF Model (when assuming different purchase prices for the Tesla stock).
At Tesla’s current stock price of $178, my DCF Model indicates an Internal Rate of Return of approximately 10% for the company (while assuming a Revenue and EBIT Growth Rate of 25% for the next 5 years and a Perpetual Growth Rate of 4% afterwards). (In bold you can see the Internal Rate of Return for Tesla’s current stock price of $178.)
|
Purchase Price of the Tesla Stock |
Internal Rate of Return as according to my DCF Model |
|
$155.00 |
14% |
|
$160.00 |
13% |
|
$165.00 |
12% |
|
$170.00 |
11% |
|
$175.00 |
10% |
|
$178.00 |
10% |
|
$180.00 |
9% |
|
$185.00 |
8% |
|
$190.00 |
8% |
|
$195.00 |
7% |
|
$200.00 |
6% |
Source: The Author
Please note that the Internal Rates of Return above are a result of the calculations of my DCF Model and changing its assumptions could result in different outcomes.
Internal Rate of Return for Ford
At Ford’s current stock price of $14, my DCF Model indicates an Internal Rate of Return of approximately 4% for the company. (In bold you can see the Internal Rate of Return for Ford’s current stock price of $14.)
|
Purchase Price of the Ford Stock |
Internal Rate of Return as according to my DCF Model |
|
$10.00 |
9% |
|
$11.00 |
7% |
|
$12.00 |
6% |
|
$13.00 |
5% |
|
$14.00 |
4% |
|
$15.00 |
3% |
|
$16.00 |
2% |
|
$17.00 |
1% |
|
$18.00 |
0% |
Source: The Author
Tesla’s higher expected compound annual rate of return once again strengthens my theory to select Tesla over Ford.
Fundamentals: Tesla in comparison to Ford and other competitors such as General Motors, BYD, Toyota and Volkswagen
At this moment in time, Tesla’s market capitalization is more than 10x higher than Ford’s: while Tesla currently has a market capitalization of $602.97B, Ford’s is $56.53B. At the same time, Tesla’s market capitalization is significantly higher than General Motors’ (NYSE:GM) ($56.73B), BYD’s (OTCPK:BYDDF) ($94.26B), Toyota’s (NYSE:TM) ($194.70B) and Volkswagen’s (OTCPK:VLKAF) (OTCPK:VWAPY) ($89.60B).
Tesla’s EBIT Margin of 16.66% is far more superior when compared to Ford (EBIT Margin of 7.05%), General Motors (8.17%), BYD (3.25%), Toyota (7.11%) and Volkswagen (8.83%), demonstrating the company’s strong competitive position and underlying my investment thesis that it’s currently the better buy.
Tesla’s Return on Equity of 23.25% is also higher than Ford’s (22.49%), General Motors’ (14.55%), BYD’s (10.46%), Toyota’s (9.29%) and Volkswagen’s (10.19%), indicating that Tesla is efficiently using shareholders’ equity to generate income.
In terms of Growth, it can be highlighted that Tesla is far superior to Ford and other competitors from the Automobile Manufacturers Industry: while Tesla has shown a Revenue Growth Rate [CAGR] of 47.41% over the past five years, Ford’s is -0.31%, General Motors’ is -0.08%, BYD’s is 26.48%, Toyota’s is 3.19% and Volkswagen’s is 3.23%.
Tesla’s superiority in terms of Growth is also underlined by its EBIT Growth Rate of 334.55% over the past three years, which is far greater than Ford’s (25.07% over the past three years), General Motors’ (13.31%), BYD’s (23.30%), Toyota’s (-2.90%) and Volkswagen’s (4.28%).
In addition to that, it can be highlighted that Tesla’s Total Debt to Equity Ratio of 14.28% is significantly lower when compared to Ford (308.31%), General Motors (165.46%), BYD (23.14%), Toyota (102.89%) and Volkswagen (107.79%).
All of these different metrics that have been used to analyze the fundamental data of these companies from the Automobile Manufacturers Industry demonstrate that, at this moment in time, Tesla can be seen as the more attractive investment when compared to Ford.
|
Tesla |
Ford |
||
|
General Information |
Ticker |
TSLA |
F |
|
Sector |
Consumer Discretionary |
Consumer Discretionary |
|
|
Industry |
Automobile Manufacturers |
Automobile Manufacturers |
|
|
Market Cap |
602.97B |
56.53B |
|
|
Profitability |
EBIT Margin |
16.66% |
7.05% |
|
ROE |
32.24% |
22.49% |
|
|
Valuation |
P/E GAAP [TTM] |
58.86 |
6.26 |
|
Growth |
Revenue Growth 3 Year [CAGR] |
45.27% |
-1.33% |
|
Revenue Growth 5 Year [CAGR] |
47.41% |
-0.31% |
|
|
EBIT Growth 3 Year [CAGR] |
334.55% |
25.07% |
|
|
EPS Growth Diluted [FWD] |
97.64% |
63.15% |
|
|
Income Statement |
Revenue |
74.86B |
151.74B |
|
EBITDA |
15.98B |
16.68B |
|
|
Balance Sheet |
Total Debt to Equity Ratio |
14.28% |
308.31% |
Source: Seeking Alpha
The High-Quality Company [HQC] Scorecard
“The aim of the HQC Scorecard that I have developed is to help investors identify companies which are attractive long-term investments in terms of risk and reward.” Here you can find a detailed description of how the HQC Scorecard works.
Overview of the Items on the HQC Scorecard
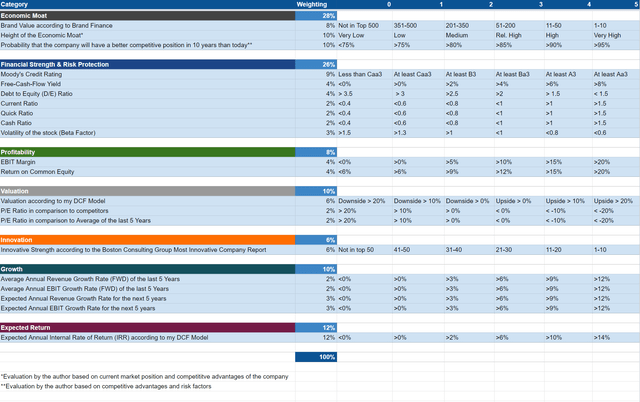
“In the graphic below, you can find the individual items and weighting for each category of the HQC Scorecard. A score between 0 and 5 is given (with 0 being the lowest rating and 5 the highest) for each item on the Scorecard. Furthermore, you can see the conditions that must be met for each point of every rated item.”
Tesla and Ford According to the HQC Scorecard
Taking into account the results of the HQC Scorecard, the investment thesis that Tesla is more attractive than Ford at this moment in time is once again backed up: while Tesla achieves an attractive rating in terms of risk and reward (69/100 points), Ford only manages a moderately attractive rating (47/100).
In almost all categories of the Scorecard, Tesla is rated higher than Ford: in the category of Economic Moat, Tesla achieves 66/100 points while Ford scores 53/100.
In the category of Profitability, Tesla achieves a very attractive rating (90/100 points), while Ford is rated as attractive (70/100). Tesla’s higher rating in this category is particularly based on the company’s significantly higher EBIT Margin (16.66%) when compared to Ford’s (7.05%).
When it comes to Growth, Tesla is rated as very attractive (100/100) while Ford only reaches a moderately attractive rating (48/100).
For Expected Return, Tesla is rated as attractive (60/100) and Ford is rated as moderately attractive (40/100).
Tesla’s significantly higher overall rating in terms of risk and reward as according to the HQC Scorecard, strengthens again my belief to select the company over Ford when deciding to invest in one out of the two automobile manufacturers.
Risks
In my previous analysis on Tesla, I mentioned that I see the biggest risk factor for investors as being the company’s growth targets not being achieved:
“One of the main risk factors that I see for Tesla investors would be in the case that the company was not able to achieve its growth targets, which could have an enormous impact on its stock price. This is in particular due to the fact that Tesla’s valuation is relatively high (with a P/E [TTM] ratio of 61.32). The high valuation of the Tesla stock is an indicator that high growth expectations are priced in.“
Another risk factor for Tesla investors would be an event that would cause its brand value to decline, as I previously discussed in my analysis on the company:
“In addition to that, I also see other events that could cause Tesla’s brand value to decline as being risk factors for investors. This is because the valuation of Tesla is also based on its high brand value and a lower brand value could cause lower customer loyalty, have an impact on the profits of the company and could cause the price of the Tesla stock to drop significantly.“
When taking a closer look at the risk factors that come attached to an investment in Ford, it can be highlighted that I also see them as being relatively high: this is based on Ford’s relatively low EBIT Margin of 7.05% as well as the company’s high Debt to Equity Ratio of 308.81%. Furthermore, Ford receives a Ba2 credit rating by Moody’s, underlying once again that an investment in the company comes with risks.
However, when comparing the risk factors of both Tesla and Ford, I see the risk being significantly higher with a Tesla investment. This is based on the fact that high growth expectations are priced into the Tesla stock and the stock price could drop significantly if these expectations are not met. Due to these risk factors related to the company, I recommend that you invest a maximum of 5% of your investment portfolio in Tesla. Additionally, I recommend that you see Tesla as a long-term investment and not to speculate on the short term.
The Bottom Line
At this moment in time, both Tesla and Ford receive my hold rating. However, if I were to select one out of the two, I would pick Tesla. My choice is based on various factors:
I consider Tesla’s competitive advantages as being stronger growth engines for the company compared to Ford. Particularly, I see Tesla’s artificial intelligence and its culture of innovation as well as its software and own supply chain as being important growth engines in the upcoming years.
In addition to that, Tesla shows a higher profitability (EBIT Margin of 16.66% compared to Ford’s 7.05%) and significantly higher Growth Rates than Ford (Tesla has a Revenue Growth Rate [CAGR] of 47.41% over the past five years while Ford’s is only -0.31%), strengthening once again my opinion to select the company over Ford.
Although I consider that the risk that comes along with an investment in Tesla is significantly higher than the risk attached to an investment in Ford (particularly because high growth expectations are priced into the Tesla stock), I would still select it over Ford. I expect that Tesla investors will be rewarded with higher capital gains over the long term. My thesis is underlined by the results of my DCF Model, which shows an expected compound annual rate of return of 10% for Tesla and just 4% for Ford (based on the companies’ current stock prices). However, due to the risk factors attached to a Tesla investment, I recommend limiting an investment to a maximum of 5% of your total investment portfolio.
(Except for the headline, this story has not been edited by PostX News and is published from a syndicated feed.)

